Tech Blog
Since 2004
Attaching to .NET Debugger w/Visual Studio ASP.NET Core
You have a website up and running, and now you want to connect the Visual Studio Debugger. This is often the case if you do not start with F5 - Debug to start the browser and automatically attach to the .net debugger. In reality, I almost never push F5. Instead, I attach to the debugger on the fly with the approach below. Take a moment to check it out.
- December 3, 2018
Rest of the Story:
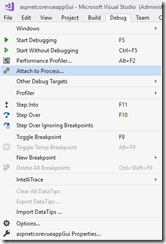
Attaching from within Visual Studio to the dotnet.exe process Debug – Attach to Process


This works fine, however to me seems too many clicks/steps to do efficiently.I have used for many years an extension to make this much easier. There are a number of these ‘Attach To’ type extensions available. The one I am using right now is AnotherAttachToAny
Once installed, I then set keystroke shortcut keys to execute the above steps. This is how it is currently configured to me. You can see I have Alt-A setup to immediately attach to the w3process (IIS), and Alt-D attaches to dotnet.exe.
This is one keystroke to attach to the running process and any breakpoints within my .net code are hit and I can then step through.

Configuration of this extension is done through Tools – Options – Another Attach To Any

Setting up a keystroke to one of the above commands is done through Tools – Options – Keyboard

This single extension has saved me hundreds of hours ![]()