I want to watch the queries made by my application during development efforts.
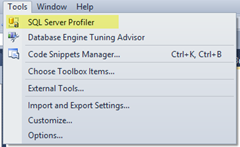
Here is what I do… from SQL Server Management Studio, select SQL Server Profiler

Start a new trace, providing the trace name (here I entered My Trace). Select ‘Tuning’ for the ‘Use the Template’. The Tuning template only watches the key events from SQL (RPC:Completed, SP:StmtCompleted, SQL:BatchCompleted). Many of the other events while important just are not important to me at this point.

Select the columns of value to you, including ApplicationName, HostName, LoginName and DatabaseName. I also like to add columns StartTime, EndTime and RowCounts

Select Column Filters. Here we will only show the events from my Application. The ApplicationName can be specified on your connection string and if you provide you can use here as a filter. As shown I have provided the Like = ODOT and also I want to exclude (checkbox) all other applications but this one. Note; You can use wildcards with the like filters i.e. % for wildcard

Select ‘Ok’ and execute some SQL. You will see in the trace ONLY your sql queries from your application. Invaluable. I often have profiler running while I am performing unit testing in order to see the generated sql execution.

Above we are showing the Duration (Amount of elapsed time (in milliseconds) taken by the event.).
Tip: when complete you can use File Save As to save the newly created profile as a Template, then when you want to re-use for another application it will be there and available (the only modification would be changing the application name variable in the filter).
Reference: SQL Server Profiler Templates MSDN